
The Naples real estate market showed strong growth by the end of 2020, despite its rocky start, with more total closed sales than the prior year. Average home prices were up 16.1 percent while the number of active listings went down by 49.1 percent over the course of the year. Homes spent an average of three months on the market (down more than a week from the previous year), partly due to lower inventory and more buyer competition.
Real Estate Market Stats from January 2020 compared to December 2020 All Data from the Naples Board of REALTORS® MLS / January 2021
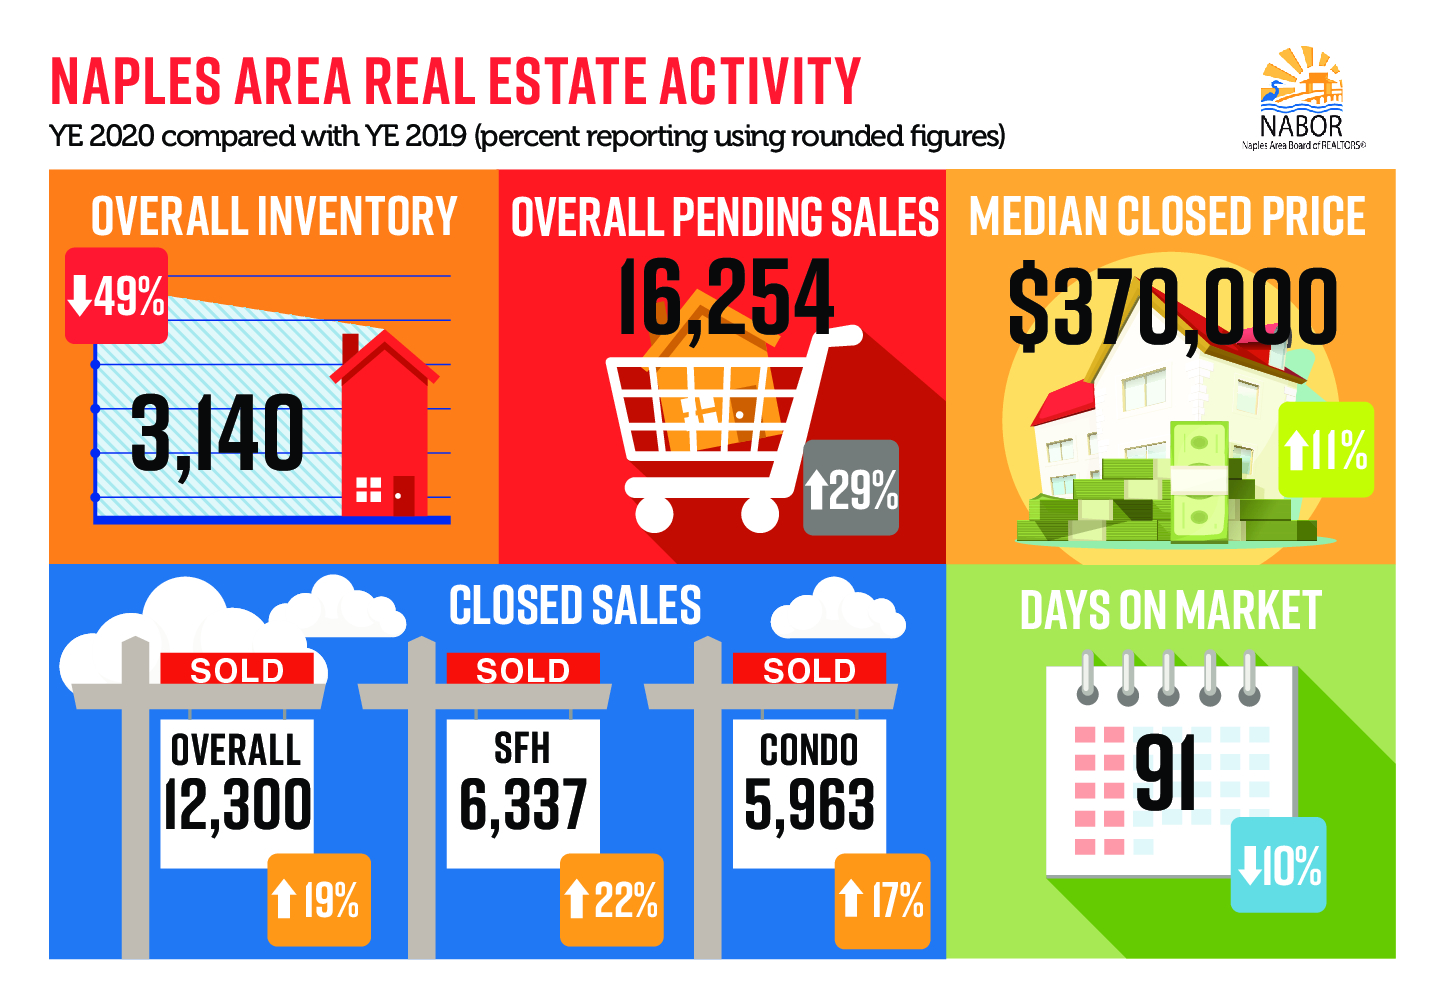
At-a-Glance Naples Real Estate Market Statistics for 2020
| Category | Year-End 2019 | Year-End 2020 | Percent Change |
| Total closed sales | 10,302 | 12,300 | +19.4 |
| Total pending sales | 12,623 | 16,254 | +28.8 |
| Median closed price | $332,000 | $370,000 | +11.4 |
| Average closed price | $589,683 | $689,162 | +16.1 |
| New listings | 15,477 | 15,582 | +0.9 |
| Total active listings | 6,163 | 3,140 | -49.1 |
| Month’s supply of inventory | 7.2 | 3.1 | -56.9 |
| Average days on market | 101 | 91 | -9.9 |
Listings Available in Naples in 2020
The total number of homes for sale in Naples dipped 49.1 percent below the previous year; at the end of December 2020, there were only 3,140 active listings in Naples. However, new listings increased by 0.9 percent by the end of the year, bringing the city’s annual total to 15,582.
Sold Home Data for Naples by Year-End 2020
Of the 12,300 homes that sold in Naples during 2020:
- 6,337 were single-family homes
- 5,963 were condominiums
2020 Home Prices in Naples
Home prices were higher in 2020 than they were during 2019. The median sales price increased by 11.4 percent to $370,000, while the average closed price increased by 16.1 percent at $689,162.
Sales by Price Range in 2020
Overall, the number of homes sold for more than $2,000,001 increased by 70.9 percent to a total of 776. Homes that sold in the $300,000 price range dropped by 0.2 percent with a total of 4,384.
Sales by Bedroom Count
Homes of all sizes sold more during 2020, but the most dramatic increase was in homes with four or more bedrooms.
List Price Received
On average, sellers received 96 percent of their original list price throughout 2020. That’s a 0.5 percent increase over what sellers received in 2019.